 |
Resources accumulation rate
The images depict two CA-2 trajectories (histories) of a typical experiment. CA-1 is not depicted. After the zygote is planted it grows and its resources decline. After maturing it starts moving toward CA-1. At time = 106 they meet. Their encounter is marked my the dashed line along the abscissa. At time = 200 interaction is stopped by the observer. When interaction stops the CA-2 in the upper trajectory resumes its default structure.
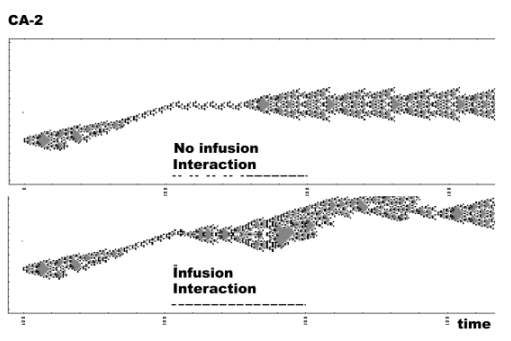 |
The lower trajectory depicts the effect of an
infusion. CA-2 is perturbed and remains chaotic even after interaction
has stopped. Finally it will assume the default structure.
The graph depicts the resource accumulation during the two experiments.
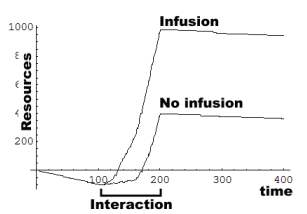 |
When interacting their resource accumulation rate v(t), increases,
however during infusion v(t) is accelerated. When interaction stops,
both start losing resources. Although both settle at their default
attractors, their resources are different.
Tolerance
Tolerance is a resource measure in a living system.
It indicates how much a system tolerates, or withstands a hazard.
The higher a tolerance the healthier it is. Whem the experiment
ends both CA look alike, yet the lower one is healthier. Tolerance
is the hidden dimension of life and the task of the physician is
to boost it. You may regard the two CA as factories, and tolerance
as their vigor.
Perturbation
The experiment illustrates the role of hazard or perturbation in
life. The above trajectory depicts the history of a non perturbed
system. By itself it is unable to accelerate its resource production
rate, only interaction with the environment (here infusion) does
it. Yet interaction is also dangerous and may kill it.
Further reading
Tolerance boosting
Tolerance accumulation
Tolerance definition