The Cancer Journal - Volume 10, Number 2 (March-April 1997)
editorial
Watch your prostate!
Medicine in the grip of technology - Although health is the main
concern of medicine, its exact meaning is not at all clear. Medicine is
more concerned with non-health, known as disease. Yet not every disease
should be regarded as non-health. Many young adults carry in their arteries
arteriosclerotic plaques without any apparent health deterioration. Are
these plaques non-health and should they be treated? Obviously health and
disease are not complementary. How then should diseases that do not impinge
upon health be handled? Sophisticated technology reveals slight aberrations
that in the past were unknown, and medicine is confronted with a new problem,
how to deal with aberrations in a patient that feels healthy? Medical confusion
is most pronounced in the treatment of breast cancer (1), and also affects
patients with prostate cancer.
Rising cancer prevalence with age - Cancer prevalence rises with
age, and in some cancers, like that of the prostate, it rises exponentially.
In autopsies of men who died of causes other than cancer, carcinoma of prostate
was found unexpectedly in 26-37% of prostates (2). Such cancers
were called incidental. Over 40% of men in their sixties with normal rectal
examinations had histological evidence of prostate cancer (3). The increase
in prevalence may indicate that in old age, cancer is less aggressive, and
grows more slowly (4). Incidental cancers
might be slow-growing aberrations that under normal circumstances would
never be detected. Yet rising cancer prevalence is also documented by epidemiological
studies, suggesting that proneness to cancer is rising. Closer analysis
of these studies reveals that most of them have fallen prey to a serious
sampling bias. As diagnostic techniques become refined they reveal smaller
and smaller aberrations whose biology differs from clinical cancers. These
findings constitute the bulk of the recently detected cancers which contribute
to the rising prevalence (5). More and more
incidental cancers are included in epidemiological reports. While prevalence
rises, cancer biology does not change.
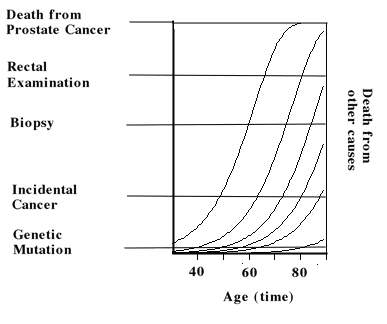 |
A simple illustration - The figure 1 illustrates hypothetical tumor
growth curves of cancers in six individuals. The left curve starts when
a single cell is transformed in to a tumor which starts growing. The curve
crosses five horizontal lines, or detection thresholds. When it crosses
the first, the tumor was detected by genetic means. The second marks the
event when the tumor was detected by chance, as an incidental cancer. The
third line indicates that the tumor was detected by a biopsy. The fourth
line marks the event when the tumor was detected by rectal examination.
When the curve hits the upper line, the patient dies from prostate cancer.
The figure depicts the fate of untreated tumors. Each of the horizontal
lines represents a detection threshold through which the tumor surfaces.
The lower the threshold, the more sensitive the detection method. The upper
line stands for the event in which the disease was diagnosed only after
death.
The second curve crosses only four horizontal lines, and does not reach
the upper one. Instead it crosses the vertical line that stands for death
from other causes. When a patient dies from myocardial infarction he carries
to his grave a small tumor that in itself did not kill him. Suppose that
prostate cancer was detected solely by rectal examination. Since the two
curves cross, or surface through, this detection threshold, rectal examination
revealed only two tumors in this example. Tumor surfacing marks the beginning
of the clinical phase of cancer. The number of growth curves crossing the
detection threshold, here two, is called cancer incidence, and the number
of curves above the threshold, also two, is called cancer prevalence. The
other four curves below the rectal examination threshold were undetected.
Lead-time bias - Now suppose that rectal examination was replaced
by routine biopsy of all males. Since this method detects smaller tumors,
the threshold is lower. Tumor incidence, and prevalence are three. Cancer
mortality remains one. Two patients died from other causes. By improving
the diagnostic method prevalence rises, yet tumor biology remains the same.
The tumor is detected 5 years earlier. However, its biology did not change,
and the patient survives with his tumor five years longer. This is known
as lead-time bias. Suppose that after biopsy was imposed upon the population,
the patients also received a new cancer drug, the improved survival would
be attributed to the drug. Although epidemiologists are aware of this bias,
it is seldom corrected. In order to avoid this bias, the new treatment ought
to be related only to the upper detection threshold. In other words, only
patents who were diagnosed by rectal examination should participate in the
clinical trial that evaluates the efficacy of the new drug. All other patients
ought to be left out. Unfortunately, this requirement is hardly ever met.
Length bias - The figure illustrates that with age, the curves are
less steep and tumor growth is slower. Prostate cancer detected incidentally
is represented by a lower horizontal line, which is crossed by five curves.
Cancer incidence, and prevalence are now five. Cancer mortality remains
one. As diagnostic means become more and more refined, more slowly growing
tumors are detected. Some require decades to reach the upper cancer death
line, and are relatively harmless, yet they are included in the statistics.
This is known as length bias. Genetic methods reveal six tumors. Prevalence
and incidence are now 6, more tumors were detected at an earlier stage,
yet the overall tumor biology did not change. Since genetic methods do not
distinguish between slow- and fast-growing tumors, the mere detection of
a cancer gene is meaningless. In other words, a young female with a BRCA1
gene may carry a slow growing tumor without any clinical significance. Should
she remove her breasts as some genetic councilors would suggest? This illustrates
the real threat to individuals who participate in genetic screening (1).
This absurd situation is caused by two conceptual flaws: 1. A complex process
such as cancer, is represented by epidemiology by only two points in time:
incidence and mortality. They do not suffice to distinguish between dangerous
and non-dangerous tumors.. Take for instance incidental tumors that are
less dangerous to the patient than overt tumors. The two tumor types cannot
be equated, or pooled together. Each tumor type poses a certain threat to
the patient, and this important information is not accounted for by epidemiology.
It is like pooling apples and oranges only because they are round. 2. Cancer
definition is incomplete. Since cancer threat is related to the method by
which it is detected, this information should be included in the term cancer.
The prevalence statistics ought to specify the diagnostic method that detected
a cancer, otherwise they are unreliable.
The Swedish example - In a thorough study, Swedish epidemiologists
demonstrated that these two biases were responsible for the rise in prostate
cancer prevalence in Sweden (6). "The incidence
of prostate cancer has increased during the past 30 years but has been paralleled
by increases in survival rates from this disease, despite the absence of
documented major improvement in curative treatment." They analyzed
a population-based cohort comprising all cases of prostate cancer (n=80,901)
detected in Sweden during the period of 1960-1988. "Most of the major
improvement in survival rates is probably not a result of improved treatment
but increased detection of non lethal tumors and lead-time bias." The
mere detection of a tumor does not reveal its biology, which remains the
missing dimension of cancer. Under these circumstance the only sound policy
for treating localized cancer of the prostate should be watchful waiting
or palliative hormonal therapy. This is how most Swedish physicians treated
their patients (6).
Gershom Zajicek
1.
Zajicek G. Lady, think twice before having a mammography. The Cancer
J 9, 172-173, 1996.
2.
Anderson's Pathology.( Kissane JM Ed); C.V. Mossby Co, St. Louis, p
907, 1990.
3.
Montie JE, Wood DP Jr, Pontes E et al. Adenocarcinoma of the
prostate in cytoprostatectomy specimens removed for bladder cancer. Cancer
63, 381-385,1989.
4.
Zajicek G. Cancer in old age is more benign than in younger adults.
The Cancer J 9, 64-65, 1996.
5.
Black WC, Welch HG. Advances in diagnostic imaging and overestimation
of disease prevalence and the benefits of therapy. NEJM 328, 1237-1243,1993.
6.
Helgesen F, Holmberg L, Johansson JE et al. Trends in prostate
cancer survival in Sweden, 1960 through 1988: evidence of increasing diagnosis
of non lethal tumors. J Nat Canc Inst 88, 1216-1221, 1996.