
|
Demicheli et al. (3) studied recurrence hazard in
pre- and post-menopausal women. 1173
patients were treated solely with mastectomy and did not
receive neither chemotherapy nor x-irradiation. The
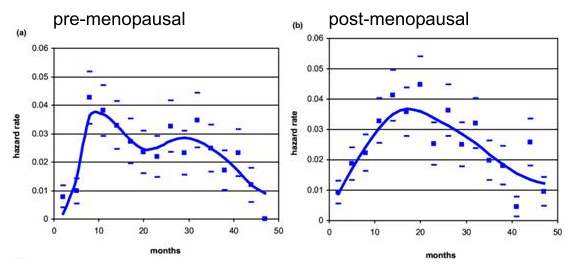
figure below was copied from their paper where it was labeled as Figure 2.
It depicts hazard rate for breast cancer recurrence
(local-regional plus distant) after mastectomy alone as primary treatment
in 1173 patients: (a) pre-menopausal patients; (b) post-menopausal patients
 |
The hazard rate actually indicates how fast cancer progresses. In the young female the disease proceeds faster than in the old, and her hazard rate is higher, which is illustrated in the figures below. They depict hazard rates of women with localized and regional breast cancer, aged respectively 20-29y and 50-59y.
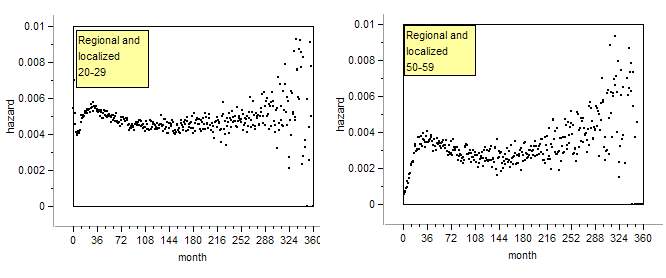 |
Following treatment the hazard rate of the young female is 0.004. It climbs
to about 0.006, declines again and for the coming years remains at the 0.004
level which is higher than that of the older female (0.0025). In the older
female the hazard following treatment is 0.0005, and it climbs to about 0.004.
Altogether it climbs higher than in the younger one, yet returns to a lower
level so that her disease progresses slower.
The next figures depict hazard rates during the first three years after treatment
has begun.
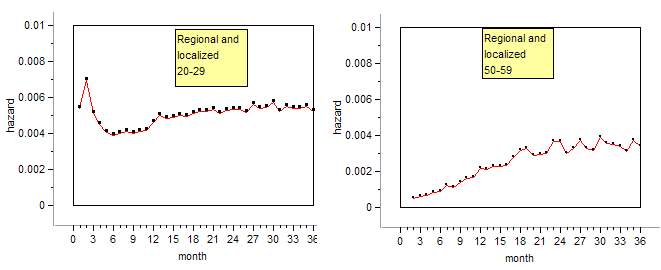 |
In the young female the hazard rate rises immediately after
treatment has begun and then drops to 0.004 whereupon it rises again. These
women were particularly dependent upon their tumors since it was detected
too early, before seeding metastasis. The older women were less tumor dependent.
Note the similarity with Figure 2 above (3).
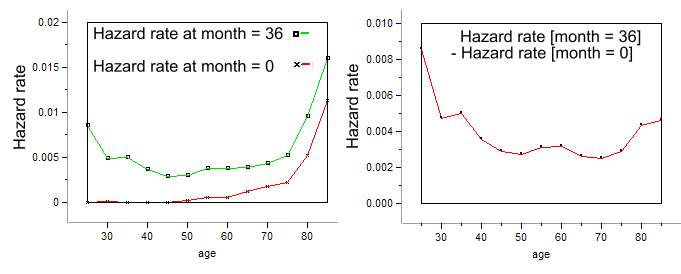
The next figures depict the relationship between age at diagnosis and the
change of the hazard rate during the first three years. The
older the female at diagnosis the higher her hazard rate. The distance between
the two curves indicates how harmful the treatment was. It is depicted in
the right figure. The higher the curve the more had the patient to depend
upon her tumor.
 |
Mammography paradox
These studies explain a mammography paradox described by Retsky et al. (2)
In the first years following screening the mortality of women aged
4049 is somewhat higher than in controls. This phenomenon was discovered
by Cox (3) Figure 1 (Retsky et al (2))
is reproduced here. (The text in the graph was added by me)
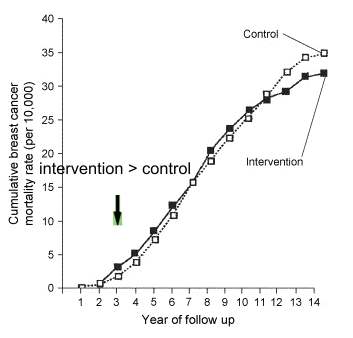 |
Figure 1. Meta-analysis data for six screening trials
for younger women from Cox showing the cumulative breast cancer specific mortality
per screened individual and the equivalent mortality per unscreened control.
The significant disadvantage ntage first appears
3 years into the trial where it is maximum. Modified from Cox (2)(3)