
|
bi-modal hazard rate (BMH)
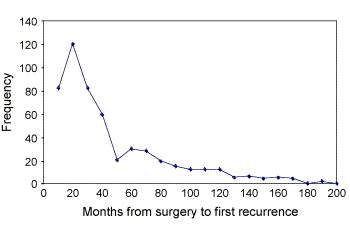
They then describe another important phenomenon, a bi-modal relapse hazard in patients untreated with adjuvant chemotherapy which they also attribute to surgery- induced angiogenesis. The figure below is a copy of their Figure 3. Milan database relapse frequency for distant plus local relapses. Data are grouped in 10-month wide bins.
 |
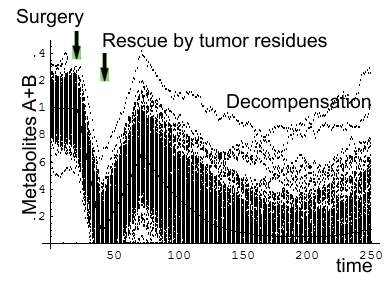
These two phenomena are manifestations of the bi-modal hazard rate (BMH) described in a previous chapter. The following model is an extension of the previous one. It illustrates the link between a deepening deficiency of pernicious cachexia , BMH and relapse frequency. The next figure depicts the level of metabolites A+B in 100 patients. Or better their trajectories.
 |
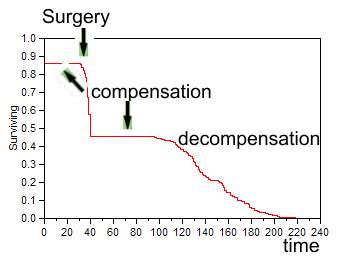
The survival curve below starts with a plateau when host and tumor produced enough A+B and cancer was compensated. Surgery initiated an acute decompensation when patients died. The rest mobilized their tumor residue, and became compensated until the final decline when tumor could not replenished enouph of the missing metabolite. Mainly because its core was necrotic.
 |
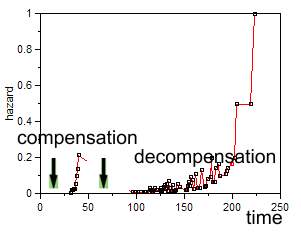
Next is the hazard rate plot with an initial sharp hazard peak
 |
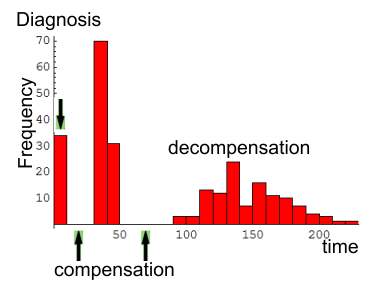
Finally the relapse frequency. The first bar stands for diagnosed tumors that were later on removed.
 |
1. M. Retsky, R. Demicheli
and W. J.M. Hrushesky
Does surgery induce angiogenesis in breast
cancer? Indirect evidence from relapse pattern and mammography paradox
International Journal
of Surgery Volume 3, Issue 3
, 2005, Pages 179-187