The hypothesis that cancer is a metabolic deficiency may
be deduced from the behavior of breast cancer hazard
rates. The present model illustrates how this deficiency shapes the survival
curve and particularly its hazard rates.
Clinically this deficiency is manifested by cachexia which is caused
by a shortage of a yet unknown metabolite A. In order to replenish
the missing metabolite the organism grows a tumor which produces a substitute
B. Since the deficiency continually aggravates the
tumor has to grow more and more in order to replenish the missing metabolite.
It then spreads into remote sites and damages them. In its early stages tumor
ablation aggravates the deficiency and the hazard raises which is most
pronounced in regional cancers. Patients with micro metastases are protected
from therapy induced total ablation and their hazard rate declines.
In short cancer is a wasting disease which gradually turns into an overt cachexia
and was therefore named pernicious
cachexia . The tumor
is regarded here as a protective measure against cachexia.
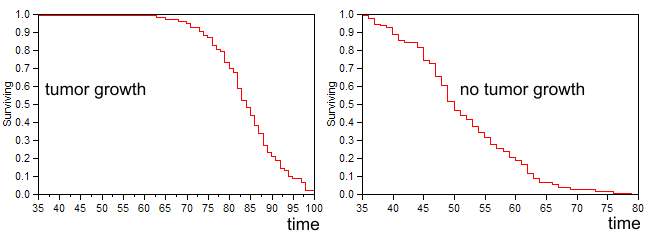
The first example depicts two groups of 100 random patients suffering from
a depletion of substance A. In the first group on the left the tumor
produces a B substitute while in the second group on the right no
tumor is formed. The left group proceeds through a phase of compensation
when the level of A+B is constant. With time the deficiency deepens and
the tumor gets bigger. It becomes necrotic, reaches its maximal production
capacity, and the level of A+B declines. Cancer becomes de-compensated. In
addition the tumor destroys vital functions driving the hazard rate to higher
levels, when A and B are finally depleted patients die in a state of cachexia.
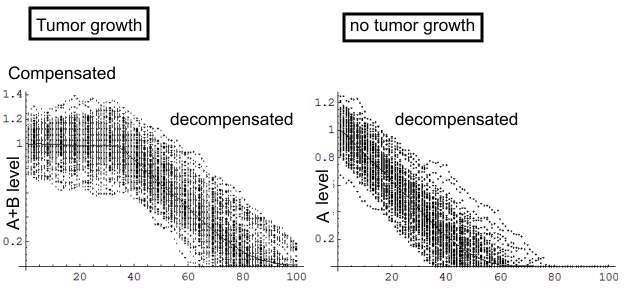 |
The graph on the right depicts patienta who lack a tumor
and from the beginning their disease is de-compensated. Indeed in several
reports published last century, the post mortem examinations of extremely
cachectic patients revealed that their tumors were very small. The next
figures depict the survival of both groups and their respective hazard rates.
 |
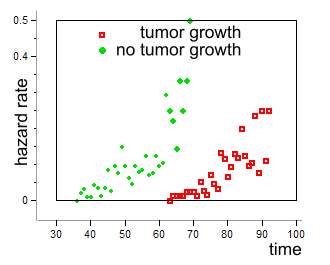 |
In summary although the deficiency continually deepens,
the tumor slows down its progression.
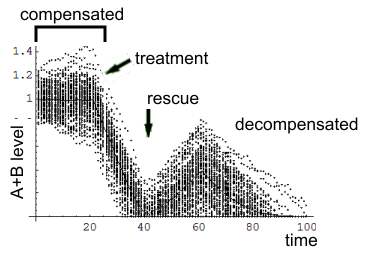
Lets turn now to the final model version which illustrates
a group of 100 patients in whom substance A declines from the beginning of
the disease. The loss is compensated by a growing tumor so that the sum of
A+B remains constant. When the tumor is finally detected and excised A+B
level declines. In some patients the tumor had seeded metastases prior to
treatment. Following the excision of the tumor they start growing and rescue
the patient from the deficiency. However since the deficiency continually
aggravates, and the growing tumor becomes necrotic B production declines.
In addition it destroys vital functions and the diseases becomes de-compensated.
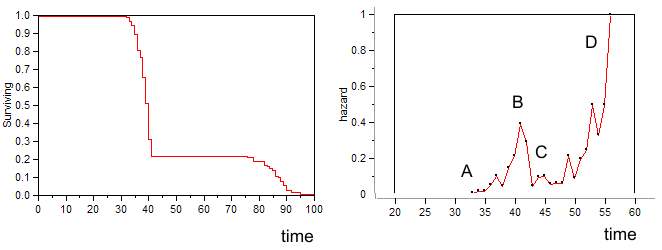
The next figures illustrates the survival curve and the
respective hazard rates.
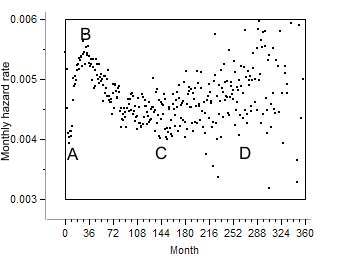
Compare it with the hazard rate computed from SEER
data
Further reading
Goompertz model of bi-modal hazard rate
Pernicious cachexia
Hazard rates of other cancers