
|
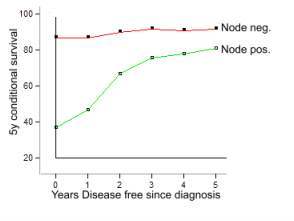
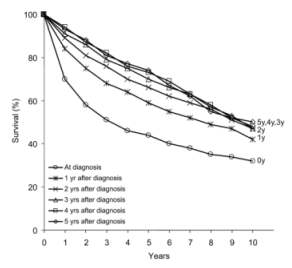
Conditional Survival is defined as the survival odds, given the pre-condition of having already survived a certain length of time (1). It is well known that in cancer conditional survival rises with time, like in the graphs reproduced here from a paper published by Ries et al (2).
 |
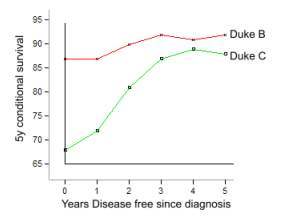
It is apparent that the slopes of the graphs are proportional to the cancer threat. In other words, their derivative is proportional to the cancer threat. In colon cancer this relationship is more convincing (3). During the first three years after diagnosis the curves depicting Duke 4 and lymph node positive cancers are steeper than those of Duke 2 or lymph node negative cancers. Later on their slopes become similar.
 |
 |
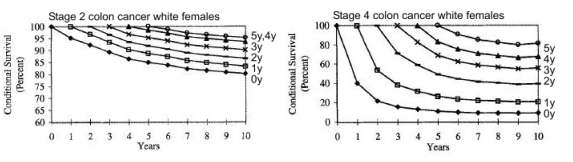
The following graphs published by Merrill et al (4) depict the phenomenon
in a different way. The conditional survival curves are drawn respectively
at intervals extending from 0 to 5 years. The graphs depict three
phenomena:
1. With advancing conditional years their slopes become less steep.
2. The slopes of stage 4 cancers are steeper than those of stage-2.
The absolute derivative value or ABS[Derivative] is proportional
to the cancer threat.
3. The absolute derivative values decline with time and approach a derivative-limit
.
 |
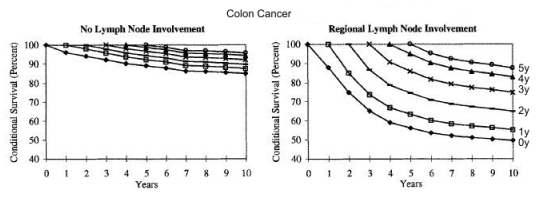
A similar pattern occurs in survival curves of patients with lymph node positive and negative colon cancers. With time their derivatives approach the same limit.
 |
In patients with B-cell lymphomas (5). The survival curves approach asymptotically one curve, a limit-survival curve.
 |
Let’s summarize the observations:
1. ABS[Derivative] is proportional to the cancer threat.
2. With time all derivatives approach asymptotically one limit which
in this short time is smaller than that of a non-conditional survival
curve (which will join them later on).
2a. The declining ABS[Derivative] indicates that the longer
the patient lives the better her chances to survive. (Since
the curves level off)
3. These conclusions are valid only for restricted time periods, here
10 years . Sooner or later ABS[Derivative] will climb (indicating that
more and more patients die).
3a Cancer progresses through two phases: Compensated
when the ABS[Derivative] declines, and de-compensated,
when it rises.
3b The above observations apply only to compensated cancers.
4. The derivative is closely related to the hazard rate
which accounts better for the biology of cancer than survival curves.
It is depicted elsewhere.
All above arguments apply also to hazard rates.
4a. During the compensated phase hazard rate declines
The longer the patient lives the better her chances to survive
This statement is an epidemiological hallmark of cancer. It applies only to cancer and not to other chronic diseases e. g. diabetes, hypertension or rheumatoid arthritis. It may be observed in acute conditions, e.g. myocardial infarction where the conditional survival rises. Yet in chronic conditions it is manifested only in cancer. It obviously does not apply to the healthy population whose conditional survival continually worsens. In other words given two hazard rates: haz[cancer] and haz[health] and their derivatives haz’[cancer] and haz’[health].
haz[cancer] >= haz[health]. In compensated cancer haz’[cancer] < 0 while haz’[health] > 0.
haz’[cancer] < 0 is an epidemiological marker of compensated
cancer.
Remember that in health haz’[cancer] > 0. The declining hazard
in cancer is usually attributed to the fact that the weak die first
leaving the strong to live on. Also in the healthy population the weak
die first yet the hazard continually rises and haz’[health] >
0. And so is the hazard in most chronic diseases.
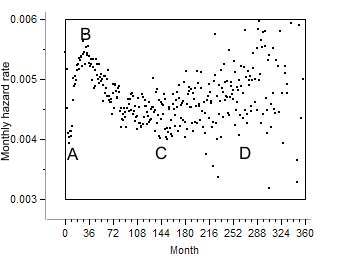
Bi-modal hazard rate (BMH)
The declining hazard is most pronounced from the 3rd year after diagnosis and onward. During the first three years the hazard is bi-modal. Following diagnosis it rises and later on declines. The rising hazard is attributed to treatment and explained elsewhere.
 |
Myocardial infarction
The conditional survival of a patient with myocardial infarction continually
rises and its hazard rate declines, which has two interpretations:
1. The survival curve describes the fate of a patient cohort
and since the weak die first and the strong continue living, the hazard
rate declines.
2. The conditional survival curve and its hazard rate describe also
the fate of a typical patient. First he is overwhelmed
by the disease and the threat (hazard) rises. Gradually he mobilizes
his regenerative (healing) processes, and the hazard declines. Obviously
treatment also contributes to the declining hazard. However treatment
does not regenerate the myocardium, it only promotes regeneration.
The patient’s fate depends on the amount of his (defensive) resources,
and the rate of their recruitment.
Similar reasoning applies to cancer.
The conditional survival curve and its hazard rate describe the fate of a typical patient. First she is overwhelmed by the disease and the threat (hazard) rises. Gradually she mobilizes her regenerative (healing) processes, and the hazard declines. Obviously treatment also contributes to the declining hazard. However in the same way as treatment does not regenerate the myocardium, it does not “regenerate” the health in cancer. It promotes regeneration. The patient’s fate depends on the amount of her (defensive) resources, and the rate of their recruitment.
The declining hazard rate indicates that with time the patient mobilizes her resources better and better. During the compensated phase she succeeds to live with cancer in peace. Yet when her resources become exhausted she dies carrying into her grave a secret, how to live with cancer in peace, which what this site attempts to unveil.
Additional reading
1. Pernicious cachexia
2. Bi-modal hazard rates (BMH)
3. Allometric law of metastasis
References
1. SEER: http://seer.cancer.gov/faststats/sites.php?site=Prostate+Cancer&stat=Definition
2. Cancer Survival and Incidence from the Surveillance, Epidemiology,
and End Results (SEER) Program
Lynn A. Gloeckler Ries, Marsha E. Reichman, Denise Riedel Lewis, Benjamin
F. Hankey, Brenda K. Edwards
The Oncologist, Vol. 8, No. 6, 541–552, December 2003
3. Conditional survival for patients with colon cancer: An analysis
of National Surgical Adjuvant Breast and Bowel Project (NSABP) trials
C-03 through C-06.
S. J. Wang, B. A. Zamboni, H. S. Wieand, G. Yothers, J. J. Dignam, P.
C. Raich, M. J. O'Connell, N. Wolmark, C. R. Thomas
Journal of Clinical Oncology, 2006 ASCO Annual Meeting Proceedings Part
I. Vol 24, No. 18S (June 20 Supplement), 2006: 6005
4. Probability of surviving 5 more years, given disease-free survival
to the times shown
Conditional survival estimates in 34,963 patients with invasive carcinoma
of the colon.
Merrill RM, Henson DE, Ries LA
Dis Colon Rectum. Sep;41(9):1097-106. 1998
5. Conditional survival of patients with diffuse large B-cell lymphoma
Michael B. Moller,., Niels T. Pedersen, Bjarne E. Christensen
Cancer 106: 10, 2165-2170. 2006