 |
Perturbation of a Non-linear Process
The previous experiment depicted an
oscillating CA with a period of 46 days.. In the present experiment
the left outmost cell was injured (its value was set to zero = white).
More about this injury is in the chapter on Injury and
Repair. The experiment was repeated 46 times. Each time a different
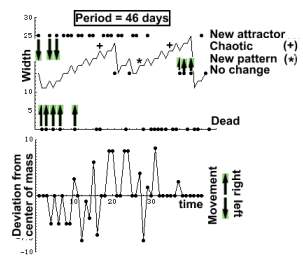
cell was injured. and the CA response examined. The image below depicts the
oscillating width of the CA. Super imposed are four rows of black
dots. The lowest row depicts CA which died after injury. The arrows pointing
upward indicate that these dots belong to the curve above. This row is
the projection of all points on the curve, whose injury (perturbation)
led to CA death.
The row above the curve represents the set
of points whose pertrbation established a new attractor with
the same period (and structure). Perturbation of the point set just below
the curve had no effect on the CA. Following two perturbations marked by a '+' the CA became chaotic. After the perturbation
marked by '*' the CA established a new attractor with a period of 29
days.
The curve below shows that in most cases the site of the new attractor was different from the original. Perturbation initiated movement toward a new attractor. (Compare with the chapter on Regeneration during chronic Injury)
 |
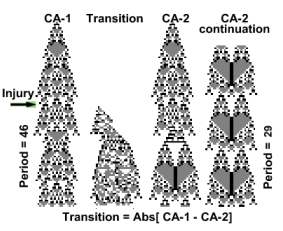
The image below depicts the transition of the CA marked by a '*'. The left CA-1 was injured and gradually turned into CA-2. The image in between is the absolute difference between an uninjured CA-1 and CA-2 which responded to injury. It shows that the perturbation proceeds from the left CA border to the right. (additional explanation in the chapter "Biological Age-1") When the transition was complete the CA entered a new attractor with a period of 29 days.
 |
Setup
effect[1,500]; injurystate[1, j, 47, f[[1,1]],
1, 0];