 |
Birth-Death process
A
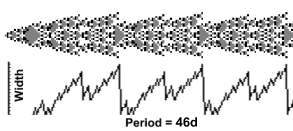
zygote is planted and the CA grows horizontally. After a brief transitory
period it starts oscillating with a period of 46 days. When the cycle
begins CA is slim. During the coming 46 days it widens and then it slims
again. In order to widen it produces new cells, which are released whenever
its size diminishes. Some cells are released immediately, other after
a short while.
 |
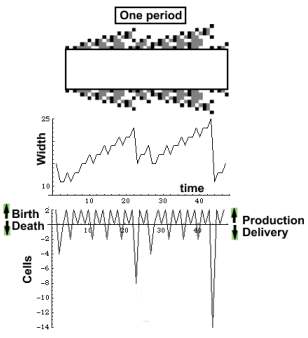
The next image illustrates what happens during one period. The CA interior was stripped off, leaving its oscillating flanks. The curve below depicts CA width. The lowest curve depicts cell production. An upward trend stands for birth, and a downward, for death. First, the curve declines from 2 to - 4 indicating that 6 cells died. Then CA produces 6 new cells and the curve rises to the previous level. Next, four cells die and other four are born . Then only two die and are immediately replaced. The dying cells are the CA product which is delivered to other CA. They may contain vital chemicals like hormones.
 |
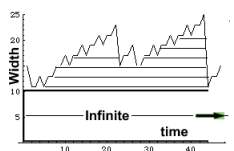
The smaller the oscillations the shorter cell survival.
Since the CA oscillates symmetrically the smallest increment is 2. The oscillations
depict cell population changes, and not the cells themselves. Like in the
smallest spikes. Where the rising slope results from the birth of one cell,
and its decline results from the death of another one. Cell survival is
depicted in the image below and is represented by the horizontal lines.
A survival gradient extends laterally from the CA body, while in
the body itself cells never die.
 |
The CA is a birth-death process with memory. Each cell remembers its past
(experience) from the time it was born. The classical birth-death processes
like, Markov chains, or Poisson processes, lack memory. Now imagine the
modeling advantages of this CA process, which the traditional processes
lack.
Setup
effect[1,
500];