 |
Health
We plant two non interacting zygotes. As the system evolves, the two CA start interacting, i = {1.6 , 1.9} . At the age of 100 days
they die. The system does not interact with the environment. It is isolated.
Now we ask at what age is it healthiest? Are young CA healthier than old, or perhaps
it is the other way around?
An isolated does not reveal its health. In order to find
what it is, we have to challenge it, and its response will reveal its health. The challenge
here, is injury. An injured system is not isolated any more, since the hazard originates in the environment.
Injury is inflicted at rising
times, and system
response monitored. During injury one bit is turned to zero. Only
CA-1 will be injured, while CA-2 will be left untouched. The effect of an
injury is described in chapters 4 and
24.
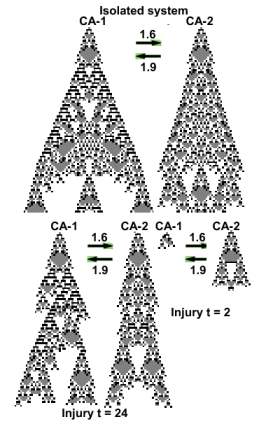
The image depicts an isolated system. Below it, the system injured at t = 2 and t = 24. The CA do not resemble the isolated pair. Following each injury both CA change their structure.
 |
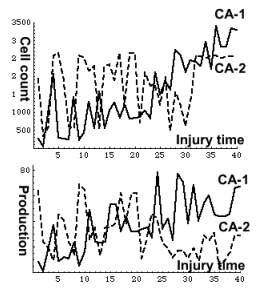
The figure below depicts cell count and production as a function of injury time. Injury hits CA-1 . Initially its size and cell production are smaller than those of CA-2. Later on the trend reverses. While CA-1 thrives, CA-2 suffers and its production declines, despite not being injured!
 |
 |
Population study
The curves depict the outcome of an experiment made on a two CA system. However, they may be interpreted also in a different way. The experiment might be performed on a group of 40 CA systems, each injured at a different time. In this context the curves stand for frequency distributions or response spectra of a CA group to different challenges. Such an interpretation will be applied in the next chapter.
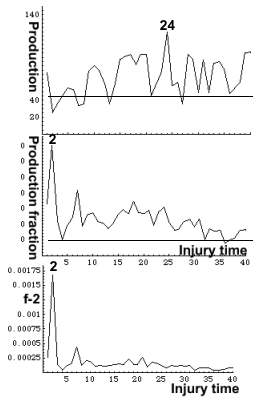
Health is system performance following injury.
In the present experiment health is defined as performance
of an injured system. Performance in an isolated system does not indicate
its health, since it is not injured. Its production is marked by the horizontal
line in the production figure. It is lower than the production by most cases,
and so is its production fraction.
It is the response to a challenge which reveals the health
of a system. If the system has enough resources to maintain production or
even improve it, it is healthy. The production fraction graph indicates
that the system's response was generally better
than that of an isolated system. It is best at injury time = 2 (= age of two
days) and declines thereafter. The system is thus healthiest when young,
and with time its health declines.
The response to a challenge is systemic
It is striking that CA-2 which is not directly hit, also
responds to injury. Injury
is strictly localized. One bit of CA-1 is replaced by a zero, and both CA
respond. The response is systemic. This is true also for our organism. Since
all processes interact, even a localized injury invokes a systemic response.
This is also the main message of this site. A tumor may appear as localized,
yet is part of a systemic response. From its very beginning,
cancer is a systemic disease.
The response to a challenge is a solution.
WOB computer.
The objective of the present study may now be stated more rigorously: Given a set of CA, how to set their impacts on each other so that their solution be optimal.
Set up
injuryrange=1; injurytime = *; effect[1,2, 1.6, sa[[1]]] effect[2,1, 1.9,
sa[[2]]]
Further reading:
What is health
Health measure: