 |
Internal injury
A previous chapter
depicted CA
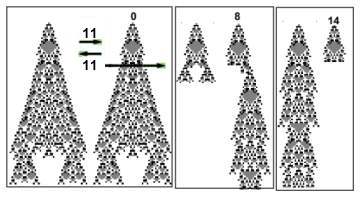
response to injury . In the present experiment we start with two
healthy CAs whose interaction is set to {11,11}. Next, CA-2 is injured deeper and deeper, along the arrow. Injury depth is marked on its top. Each
CA responds to the insult in a different way. CA-2 attempts to repair
the damage, in the same way as described
before. These attempts affect also CA-1 structure.
Like in the second frame. When the cut eliminates 8 pixels, CA-1 shrinks.
Finally, when CA-2 is cut through, its impact on CA-1 vanishes, {11, 0}
and CA-1 assumes it non-interacting structure
.
 |
Primary and secondary response
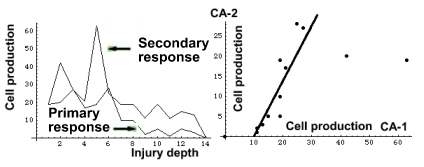
The left graph below, depicts a declining cell production
in both CAs. While the decline in
CA-2 results from the injury itself, CA-1 responds to changes of
CA-2 structure, and not to the injury itself. We shall distinguish between
two kinds of response to injury.
Primary, manifested here by CA-2, and secondary, manifested by CA-1.
The second graph depicts the correlation between cell production
of the two CAs. Depending on their mutual impact, this correlation may even
vanish.
 |
Disease indicator
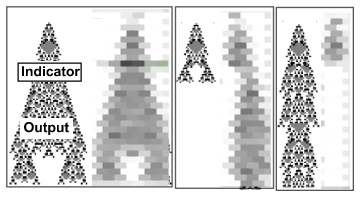
Imagine that the response of CA-2 to injury is concealed
from us, and we are unaware of its cause. On the other hand we are able
to observe the behavior of CA-1, which
indicates that something
is going on inside. CA-1 serves
as an indicator of a hidden damaged process. In medical terms, it is a sign
or symptom. Since CA-1 itself changes, we tend to conclude that it is sick,
while in reality it is healthy.
This illusion clouds medical reasoning, and harms many patients. Like in
essential hypertension . Rising blood pressure indicates a derangement
of hidden processes, yet medicine regards it as primary damage. In reality
it is a secondary response to hidden damaged processes, whose primary damage
is still unknown. Yet medicine rushes to treat it as if it were the only
manifestation of the disease.
Observe the CA couple, and imagine how would treatment of CA-1 affect both CAs? Everything would get worse!.
 |
WOB computer
This experiment illustrates also how an output of a WOB
computer might look like. The
means to read process memory were described before. Since WOB is a set
of processes, we are concerned how to output its state. The indicator
process, here CA-1 is a possible output, or better, the set of indicator processes,
which may be accessed by our measuring
devises is WOB output.
Additional reading:
WOB computer
Diabetes.mellitus