 |
Maximize cell production!
When two CAs interact, the state of one
shapes the age distribution of the other . Their interaction is determined
by .Impact, which is a couple { i , j } i stands for the impact of CA-1
on CA-2, and j for the opposite. Impact determines the age at which a cell dies.
CA task is to produce (dead) cells, which carry chemicals to other
processes. The present experiment demonstrates how impact maximizes
dead cell production.
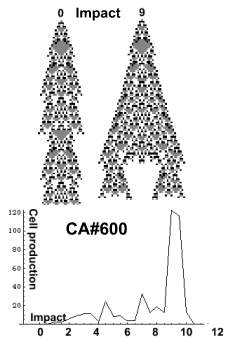
The first example shows the effect of a rising impact on
the CA itself. At each instant, CA state shapes its own age distribution. It may be regarded as an auto-stimulation,
or auto-feedback. In the left CA, impact = 0. Here
states do not affect age. Since
this CA lives for ever, its
cells are immortal, and no dead cells are produced.
The impact of its neighbor was set to 9, and it produces 130 cells in 100
time units. The curve below depicts the effect of a rising impact on its
cell production. As impact rises the CA produces more cells. Yet when impact
is excessive the CA dies of exhaustion
 |
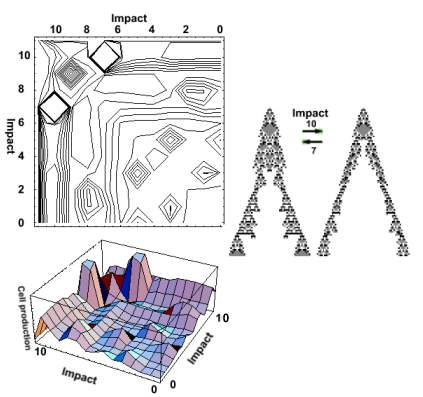
In the following experiment the mutual impact of the two CAs on each other was
raised from 0 to 12, and the total cell production determined. The x and
y axes of the contour plot depict respectively the impact of CA-1 on CA-2
and vice versa. The z-axis represented by the contours depicts the magnitude
of cell production. The plot is symmetric since the impact {i , j}
of CA-1 is equal to
the impact {j , i} of CA-2 , and their cell production is the same.
The 3-D plot below depicts two cell production peaks of 1091 cells, at i =7 and j =10 (or j =7, and i =10). The two top producers are depicted on the right.
 |