 |
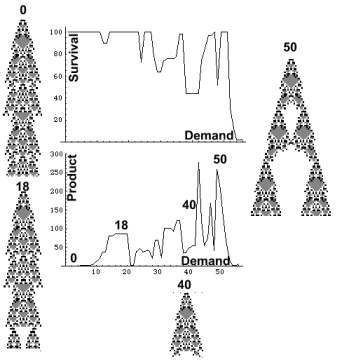
Demand
| f[state[j, i], rule[#], max age] = f[state[j, i - 1], rule[#], demand] |
The CA produces dead cells whose content is a chemical
required by other CAs. Like a hormone, which is produced by one process
(pituitary) and affects other processes, or target organs (ovary). Cell death is determined by a threshold parameter 'max-age'.As max-age
declines cells die younger. CA demand is controlled by target organs via
max-age.
 |
When to harvest?
The most productive CA (=50) produces daily 258 cells, Yet one needs 100 days in order to grow it to its full capacity. Why not kill it sooner and harvest its entire cell content? The upper curve in the following figure, depicts CA cell content from seeding and onward. A 50 day old CA has 774 cells. If killed at this age and a second CA planted instead, we might get in 100 days 1548 cells. In order to decide how to proceed, let’s examine the second curve which is derived by dividing CA cell content by the time it take to grow it. If we kill a mature CA we harvest 2738 cells. In order to get this yield we have to wait 100 days. The average yield per day is 27.38 while if we let a CA live happily ever after we harvest 258 cells/day.
 |
The depicted CA is an instantaneous image of a cell generating process. Since it maintains steady state, its structure reveals certain aspects of its time dimension. Like the fact that a cell at location 'i +1' is older than its neighbor at location 'i' , In order to harvest it we have to wait 'i' time units. In this setup location and time are equivalent. In the above example we are impressed with the fact that an adult CA contains 2738 cells which is 10 times more than it produces daily. Yet when considering the time element we rather let it live.
Further reading:
Streaming Tissues