Rising demand-3
The present experiment is the same
as the last one except that the rules were switched.
delivery[1,
1, k, 2] ;
If[ p[1,prev] > p[1,now], set
rule[600]; Min[++k, 70], else [set rule[250]]
CA-1 starts as an isolated process (rule
= 600). At time = 20 the demand starts rising. When demand rises, CA-1 switches between rules
600 and 250. When production{previous] >
production[now] CA-1 applies
rule-600 and raises k, . When production{previous]
< production[now] CA-1 applies rule-250. At k = 70 it starts declining.
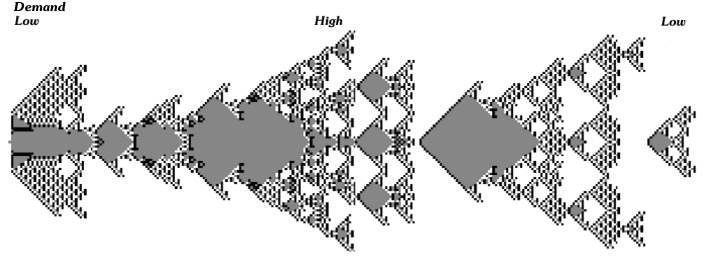
When demand starts rising and the CA responds
by switching rules as described above.
When demand = 70 CA reaches its maximal width. Then demand starts
declining until reaching its minimum. At this point the experiment ends.
If prolonged CA would displayed similar patterns again and again.
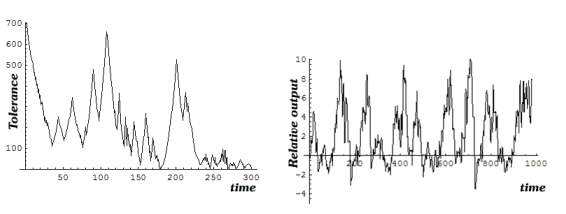
The next image depicts CA-1 tolerance
and output. Tolerance continually declines. Output is a 20
days running average. Here output
is greater than in the previous experiment.
CA-1 diverts most of its resources to output and loses tolerance.
The last image depicts CA-1
tolerance at each point of the CA above. Gray level is proportional
to tolerance. It is a health indicator. In
the beginning CA-1 had a tolerance of an isolated CA.
As it responds to demand its tolerance declines,
showing that CA-1 health deteriorates.
delivery:
[j, j-1, While[p[j-1] > set point], 2]
Argument[1]: Activated CA.
Argument[2]: Activating CA.
Argument[3]: Delivery condition.
Argument[4]: Delivery amount.
p[j]: daily production