Non-linear flip-flop-1
We continue exploring ways to raise CA output. Previously
output was boosted by augmenting CA-1 state .
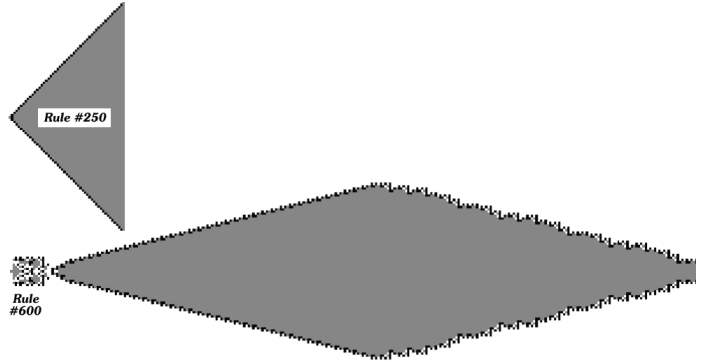
The present experiment attempts to increase output by replacing rule- 600 with rule- 250.
delivery[1, 1, k, 2] ;
If[ p[1,prev] > p[1,now], set
rule[250]; Min[++k, 70], else [set rule[600]]
CA-1 starts as an isolated process (rule
= 600). At time = 20 the demand starts rising. When demand rises, CA-1 switches between rules
600 and 250. When production{previous] >
production[now] CA-1 applies
rule-250 and raises k, . When production{previous]
< production[now] CA-1 applies rule-600. At k = 70 it starts declining.
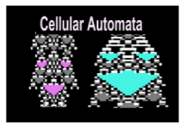
The upper CA in the image depicts an isolated
CA controlled by rule = 250. Up
to time = 20 the CA below remains isolated.
Then demand starts rising and the CA responds by switching rules
as described above. When demand = 70 CA reaches its maximal width.
Then demand starts declining until reaching its minimum. At this point
the experiment ends. If prolonged, CA would displayed the same pattern again and again.
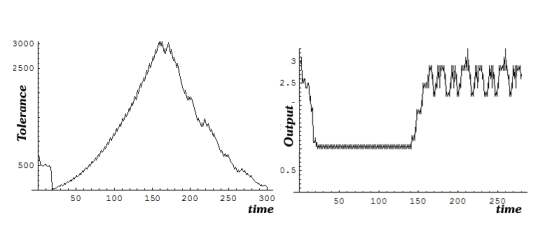
The next image depicts CA-1 tolerance and
output. Output is a 20 days running average. As demand rises CA-1 accumulates resources and
its output is low. When demand
declines CA-1 diverts most of
its resource to output and loses tolerance.
 |
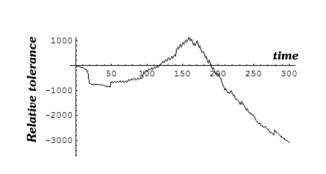
The last image depicts CA-1
tolerance accumulation relative to CA-0. CA-1[tolerance]
CA - 0[tolerance]. This is a health indicator showing that
CA-1 health declines. The experiment depicts one cycle
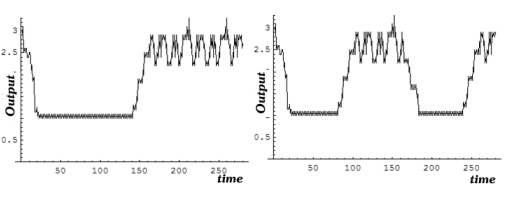
of an ongoing process which continues oscillating endlessly. Rising
demand initiates a CA build up with meager output which rises when
demand declines. Neither
is output correlated with rising demand, nor when demand declines.
Demand triggers CA-1 out of its isolation. However CA-1
is unable to respond immediately. It first accumulates resources,
and only after trigger subsides, output rises and oscillates about
a constant level.
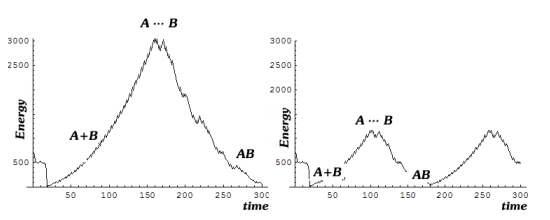
Enzymatic reaction
The tolerance curve depicts
also a reaction between two molecules, A and B. At peak tolerance
which is also the peak demand, A and B start to resonate, and when
demand declines they form a covalent bond. Actually tolerance which
is proportional to accumulated
resources may be regarded as an energy analog.
The curve on the right depicts
the effect of an enzyme which lowers the energy (tolerance) level
at which the two molecules resonate.
Yet there is more to it. The
CA is a process which operates on two other processes. One supplies
the molecules, and the other, the
enzyme. It is formed at the gene from where it approaches the
reaction site. After it has accomplished its task it continues to
its graveyard where it is catabolized. The curve illustrates further that the enzyme
has two effects: energy saving, and reaction acceleration.
More on enzyme processes v.Citric
acid cycle.
Flip-Flop
As demand rises and declines, output
switches between two sates which might be regarded as on and off.
It is a CA clock whose rate can be accelerated by
controlling the demand. Similar flip-flops operate in the organism accounting
for threshold effects, like action potentials in nerves or the sinus node in the heart. By lowering
the upper demand the flip-flop accelerates (tachycardia) and vice
versa.
delivery:
[j, j-1, While[p[j-1] > set point], 2]
Argument[1]: Activated CA.
Argument[2]: Activating CA.
Argument[3]: Delivery condition.
Argument[4]: Delivery amount.
p[j]: daily production